
Bloomburrow Commander Sealed · Commander precon
Is Bloomburrow Commander Deck Display Worth Opening?
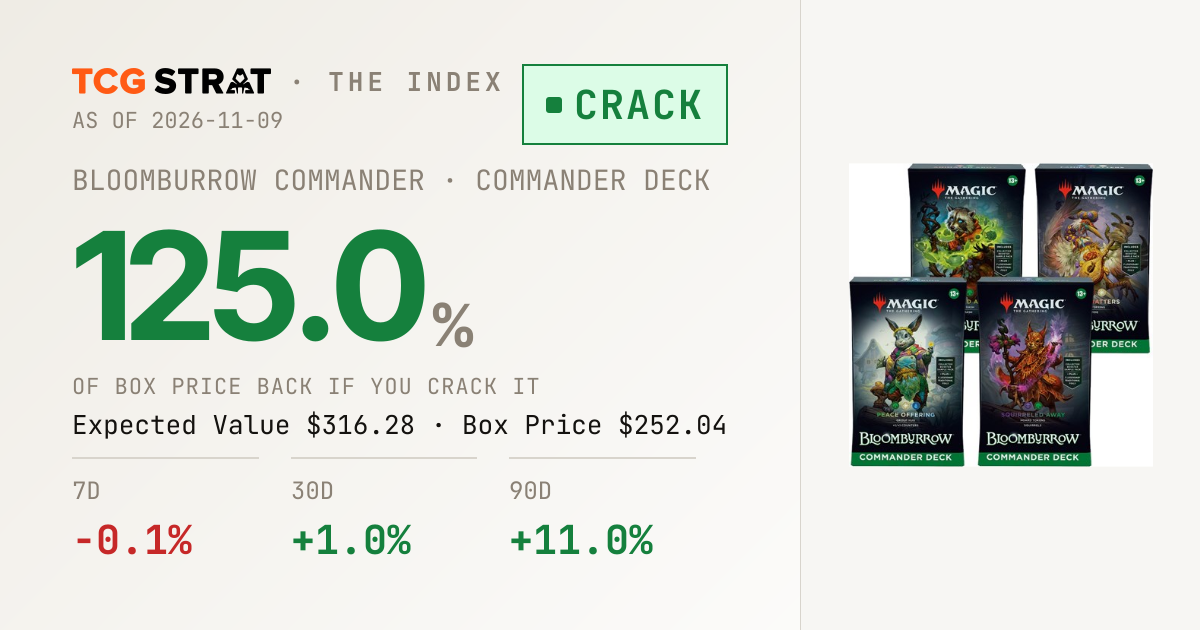
EV $316.28, $64.24 more card value than the deck costs.

Affiliate links. TCG Strat may earn a commission from TCGplayer, Mana Pool and eBay. As an Amazon Associate we may earn from qualifying purchases. Mana Pool observed Nov 9, 2026, before shipping.
About Bloomburrow Commander Deck Display
At $252.04 it trades near the top of its one-year range of $116.74 to $270.76.
Bloomburrow Commander Deck Display Price History
TCGplayer market price for the sealed deck, past 12 months, against its crack EV.
Mana Pool lowest listing · USD, before shipping · last observed
Crack EV has held above deck price for 228 days.
- Now
- $252.04
- TCGplayer market
- 1-year high
- $270.76
- 7.4% above today
- 1-year low
- $116.74
- Today is 115.9% higher
Crack or keep sealed
EV Notes
Verdict: Crack 1.25×
The Bloomburrow Commander Deck Display sells for $252.04 and carries $316.28 in expected card value at market, a 1.25× ratio and $64.24 more than the deck costs.
Five-tier verdictEV ratio
Crack 1.10× and up This deck, 1.25×
Favored 1.00× to 1.10× Slight crack.
Neutral 0.90× to 1.00× Coin flip.
Hold 0.75× to 0.90× Keep it sealed.
Skip under 0.75× Pass.
Bloomburrow Commander Deck Display FAQ
Is Bloomburrow Commander Deck Display worth opening?
Open it. Median crack value is $316.28 against a $252.04 deck price (1.25× EV ratio), EV as of 2026-11-09.
What is the best card you can pull from Bloomburrow Commander Deck Display?
The top pull by value is Alchemist's Talent (about $14.88), with roughly a 100.0% chance per deck.
Details and daily prices
Bloomburrow Commander Deck Display currently sells for $252.04 at market, down 6.4% over 30 days and up 9.4% over 90 days. All-time tracked high: $338.05 (2024-12-22); low: $116.74 (2025-11-28).
920 daily snapshots. Last update 2026-11-09.
Daily prices, last 30 snapshots
High at or above $500 is flagged: it is the top active listing, which can be set arbitrarily, so read Market as the signal.
| Date | Market | Low | Mid | High (flag) |
|---|---|---|---|---|
| 2026-11-09 | $252.04 | $239.99 | $283.48 | $500.00 |
| 2026-11-08 | $253.12 | $239.99 | $281.96 | $500.00 |
| 2026-11-07 | $253.16 | $239.99 | $283.48 | $500.00 |
| 2026-11-06 | $255.55 | $230.00 | $281.48 | $500.00 |
| 2026-11-05 | $257.86 | $249.00 | $280.99 | $500.00 |
| 2026-11-04 | $257.47 | $248.49 | $279.99 | $500.00 |
| 2026-11-03 | $257.47 | $248.49 | $280.49 | $500.00 |
| 2026-11-02 | $258.72 | $240.00 | $279.87 | $500.00 |
| 2026-11-01 | $261.77 | $240.00 | $279.87 | $500.00 |
| 2026-10-31 | $262.38 | $240.00 | $279.40 | $500.00 |
| 2026-10-30 | $262.93 | $240.00 | $279.79 | $500.00 |
| 2026-10-29 | $264.72 | $240.00 | $279.87 | $500.00 |
| 2026-10-28 | $265.08 | $240.00 | $279.97 | $500.00 |
| 2026-10-27 | $266.24 | $248.49 | $279.99 | $500.00 |
| 2026-10-26 | $266.78 | $248.49 | $279.99 | $500.00 |
| 2026-10-25 | $266.92 | $239.75 | $279.97 | $500.00 |
| 2026-10-24 | $266.92 | $239.75 | $279.99 | $500.00 |
| 2026-10-23 | $266.81 | $239.75 | $279.97 | $500.00 |
| 2026-10-22 | $267.05 | $239.91 | $279.99 | $500.00 |
| 2026-10-21 | $267.05 | $248.49 | $279.99 | $500.00 |
| 2026-10-20 | $268.00 | $248.49 | $281.48 | $500.00 |
| 2026-10-19 | $267.15 | $248.49 | $284.99 | $500.00 |
| 2026-10-18 | $268.17 | $257.00 | $287.99 | $500.00 |
| 2026-10-17 | $269.96 | $257.00 | $285.98 | $500.00 |
| 2026-10-16 | $270.76 | $250.00 | $285.98 | $500.00 |
| 2026-10-15 | $270.76 | $257.00 | $287.99 | $500.00 |
| 2026-10-14 | $270.76 | $268.25 | $289.99 | $500.00 |
| 2026-10-13 | $270.76 | $268.25 | $289.99 | $500.00 |
| 2026-10-12 | $270.76 | $268.25 | $292.50 | $500.00 |
| 2026-10-11 | $270.33 | $265.00 | $289.50 | $500.00 |