
Modern Horizons 3 Commander Sealed · Commander precon
Is Modern Horizons 3 Commander Deck Display Worth Opening?
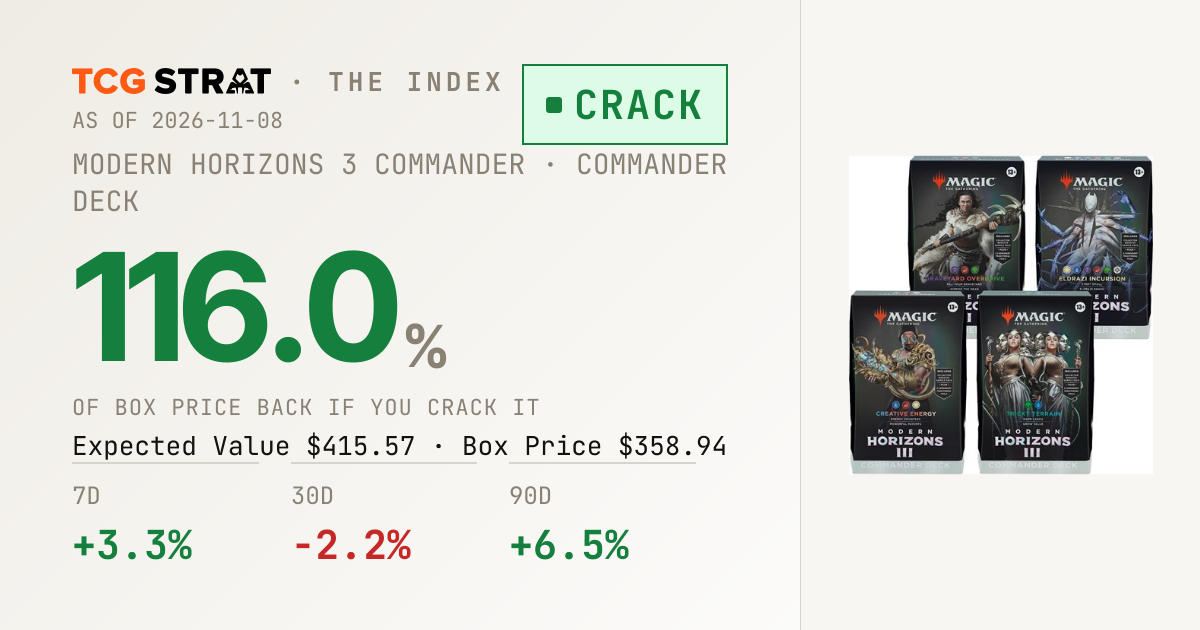
EV $415.57, $56.63 more card value than the deck costs.

Affiliate links. TCG Strat may earn a commission from TCGplayer, Mana Pool and eBay. As an Amazon Associate we may earn from qualifying purchases. Mana Pool observed Nov 8, 2026, before shipping.
About Modern Horizons 3 Commander Deck Display
At $358.94 it trades near the top of its one-year range of $174.26 to $363.85.
Modern Horizons 3 Commander Deck Display Price History
TCGplayer market price for the sealed deck, past 12 months, against its crack EV.
Mana Pool lowest listing · USD, before shipping · last observed
Crack EV has held above deck price for 239 days.
- Now
- $358.94
- TCGplayer market
- 1-year high
- $363.85
- 1.4% above today
- 1-year low
- $174.26
- Today is 106.0% higher
Crack or keep sealed
EV Notes
Verdict: Crack 1.16×
The Modern Horizons 3 Commander Deck Display sells for $358.94 and carries $415.57 in expected card value at market, a 1.16× ratio and $56.63 more than the deck costs.
Five-tier verdictEV ratio
Crack 1.10× and up This deck, 1.16×
Favored 1.00× to 1.10× Slight crack.
Neutral 0.90× to 1.00× Coin flip.
Hold 0.75× to 0.90× Keep it sealed.
Skip under 0.75× Pass.
Modern Horizons 3 Commander Deck Display FAQ
Is Modern Horizons 3 Commander Deck Display worth opening?
Open it. Median crack value is $415.57 against a $358.94 deck price (1.16× EV ratio), EV as of 2026-11-08.
What is the best card you can pull from Modern Horizons 3 Commander Deck Display?
The top pull by value is Talon Gates of Madara (about $35.76), with roughly a 100.0% chance per deck.
Details and daily prices
Modern Horizons 3 Commander Deck Display currently sells for $358.94 at market, down 0.9% over 30 days and up 16.4% over 90 days. All-time tracked high: $363.85 (2026-09-26); low: $174.26 (2025-12-25).
918 daily snapshots. Last update 2026-11-08.
Daily prices, last 30 snapshots
High at or above $500 is flagged: it is the top active listing, which can be set arbitrarily, so read Market as the signal.
| Date | Market | Low | Mid | High (flag) |
|---|---|---|---|---|
| 2026-11-08 | $358.94 | $324.83 | $364.91 | $575.75 |
| 2026-11-07 | $359.90 | $325.00 | $359.95 | $575.75 |
| 2026-11-06 | $359.90 | $325.00 | $359.95 | $575.75 |
| 2026-11-05 | $359.90 | $325.00 | $359.98 | $575.75 |
| 2026-11-04 | $359.90 | $334.75 | $364.95 | $575.75 |
| 2026-11-03 | $360.74 | $334.75 | $364.95 | $575.75 |
| 2026-11-02 | $360.74 | $334.75 | $364.95 | $575.75 |
| 2026-11-01 | $360.74 | $334.75 | $364.99 | $575.75 |
| 2026-10-31 | $360.74 | $334.75 | $370.00 | $575.75 |
| 2026-10-30 | $360.74 | $334.75 | $367.50 | $575.75 |
| 2026-10-29 | $360.74 | $334.75 | $370.00 | $575.75 |
| 2026-10-28 | $360.74 | $334.75 | $367.50 | $575.75 |
| 2026-10-27 | $360.74 | $334.75 | $367.50 | $575.75 |
| 2026-10-26 | $361.36 | $334.75 | $367.50 | $575.75 |
| 2026-10-25 | $361.36 | $334.75 | $367.50 | $575.75 |
| 2026-10-24 | $361.36 | $334.75 | $367.50 | $575.75 |
| 2026-10-23 | $361.36 | $339.44 | $370.00 | $575.75 |
| 2026-10-22 | $361.36 | $339.44 | $370.00 | $575.75 |
| 2026-10-21 | $361.36 | $339.44 | $367.50 | $575.75 |
| 2026-10-20 | $361.36 | $339.44 | $370.00 | $575.75 |
| 2026-10-19 | $361.36 | $339.44 | $370.00 | $575.75 |
| 2026-10-18 | $362.19 | $339.44 | $374.50 | $575.75 |
| 2026-10-17 | $362.19 | $339.44 | $370.00 | $575.75 |
| 2026-10-16 | $362.19 | $339.44 | $374.50 | $575.75 |
| 2026-10-15 | $362.19 | $339.44 | $374.50 | $575.75 |
| 2026-10-14 | $362.19 | $339.44 | $374.50 | $575.75 |
| 2026-10-13 | $362.19 | $339.44 | $378.99 | $575.75 |
| 2026-10-12 | $362.18 | $339.44 | $378.99 | $575.75 |
| 2026-10-11 | $362.18 | $339.44 | $378.99 | $575.75 |
| 2026-10-10 | $362.18 | $359.49 | $384.44 | $575.75 |